The Mail & Guardian carried a very interesting story in its most recent edition. The first of a two-parter, it’s about turning our ideas of South Africa’s violent protests on their head and getting to the bottom of the protest trends over the past five years.
It’s also interesting because it shows how complex stories can be executed in the small, time-pressed newsrooms of today: and that is in partnership with someone else. In this case, the story is the product of a partnership between academia and journalism – between Prof Jane Duncan, the Highway Africa Chair of Media and Information Society at Rhodes University’s School of Journalism and Media Studies, and the Mail & Guardian’s Laura Grant. It is based on research funded by the Open Society Foundation for South Africa.
Most instructive of all, it is an excellent example of the interesting stories can come out of data mining – the kind of stories that would not have been possible before the days of data journalism.
SEE ALSO: “The best way to start doing data-driven journalism is simply to start”, Dec 2013
Duncan’s research looks at notifications sent to 12 municipalities across SA over five years by various organisations for gatherings and protests.
The municipalities are a mix of urban, periurban and rural with a bias towards the Eastern Cape (where Duncan is based) and mix up municipalities with varying degrees of protest action. For example, there is Mbombela in Mpumalanga – where there was a large number of “unrest-related protests” (a police term) relative to peaceful ones – compared with Lukhanji in the Eastern Cape, where there were practically no “unrest-related protests” and most were peaceful.
For the data project, Duncan used Media24 Investigations’ PAIA request to police for protests in different parts of the country in order to decide which municipalities to focus on, she told Grubstreet, and used various Google tools to mine the data to see what trends emerged.
No PAIA requests were needed to the get the information out of the 12 municipalities except for Cape Town.
“It’s an incredibly rich source of information about people getting out into the streets, why they are doing so and how that’s changing over time,” she says. “The fundamental objective is to try find a more evidence-based way of telling the story of protest because too much of both the reportage and the comment tends to be quite impressionistic and tends to be based on the barometers that are developed from media stories.
“The problem with that is a lot of the media coverage takes place only when the bullets are flying or the tyres are being burned or the councillor’s house is being burned down. This data shows the humdrum of protests taking place day in, day out and goes off with much fanfare – and because of that, it often isn’t reported.
“Unfortunately, what this is leading to is an over emphasis on violent protest – not only in the reporting but in the analysis as well – skewing a lot of the findings by organisations like MunicipalIQ, for instance, towards violent protest which in turn feeds into a moral panic about the protests. Which in turn can inadvertently make the case for greater state repression.”
The aim is that the M&G print-edition stories will be accompanied by an online data-journalism resource on protest, including all the raw data and other protest information for comparison (like the police data).
“The intention is to grow it into a resource of raw information on the protests that can be mined by researchers, journalists and civil society,” Duncan told Grubstreet. “The M&G has done a huge amount of work on visualising the data using Google Fusion, which should become apparent soon if all goes well.”
How fascinating!
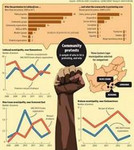
Picture Caption: The Mail & Guardian’s infographic that accompanied the story in the most recent edition.
By Gill Moodie
Article Source: http://grubstreet.co.za